> ## Documentation Index
> Fetch the complete documentation index at: https://docs.encoreos.io/llms.txt
> Use this file to discover all available pages before exploring further.
# Performance Management
> The performance management hub — track review cycles, completion rates, goals, feedback, and improvement plans from a single dashboard.
## Overview
Performance Management (HR-10) is where HR administrators and managers run the
organization's review program. Open it from **HR → Performance** (route
`/hr/performance`). The dashboard rolls up the state of every active review cycle —
how many reviews are complete, in progress, overdue, or awaiting acknowledgment —
alongside goals, 360-degree feedback, and performance improvement plans.
## The performance dashboard
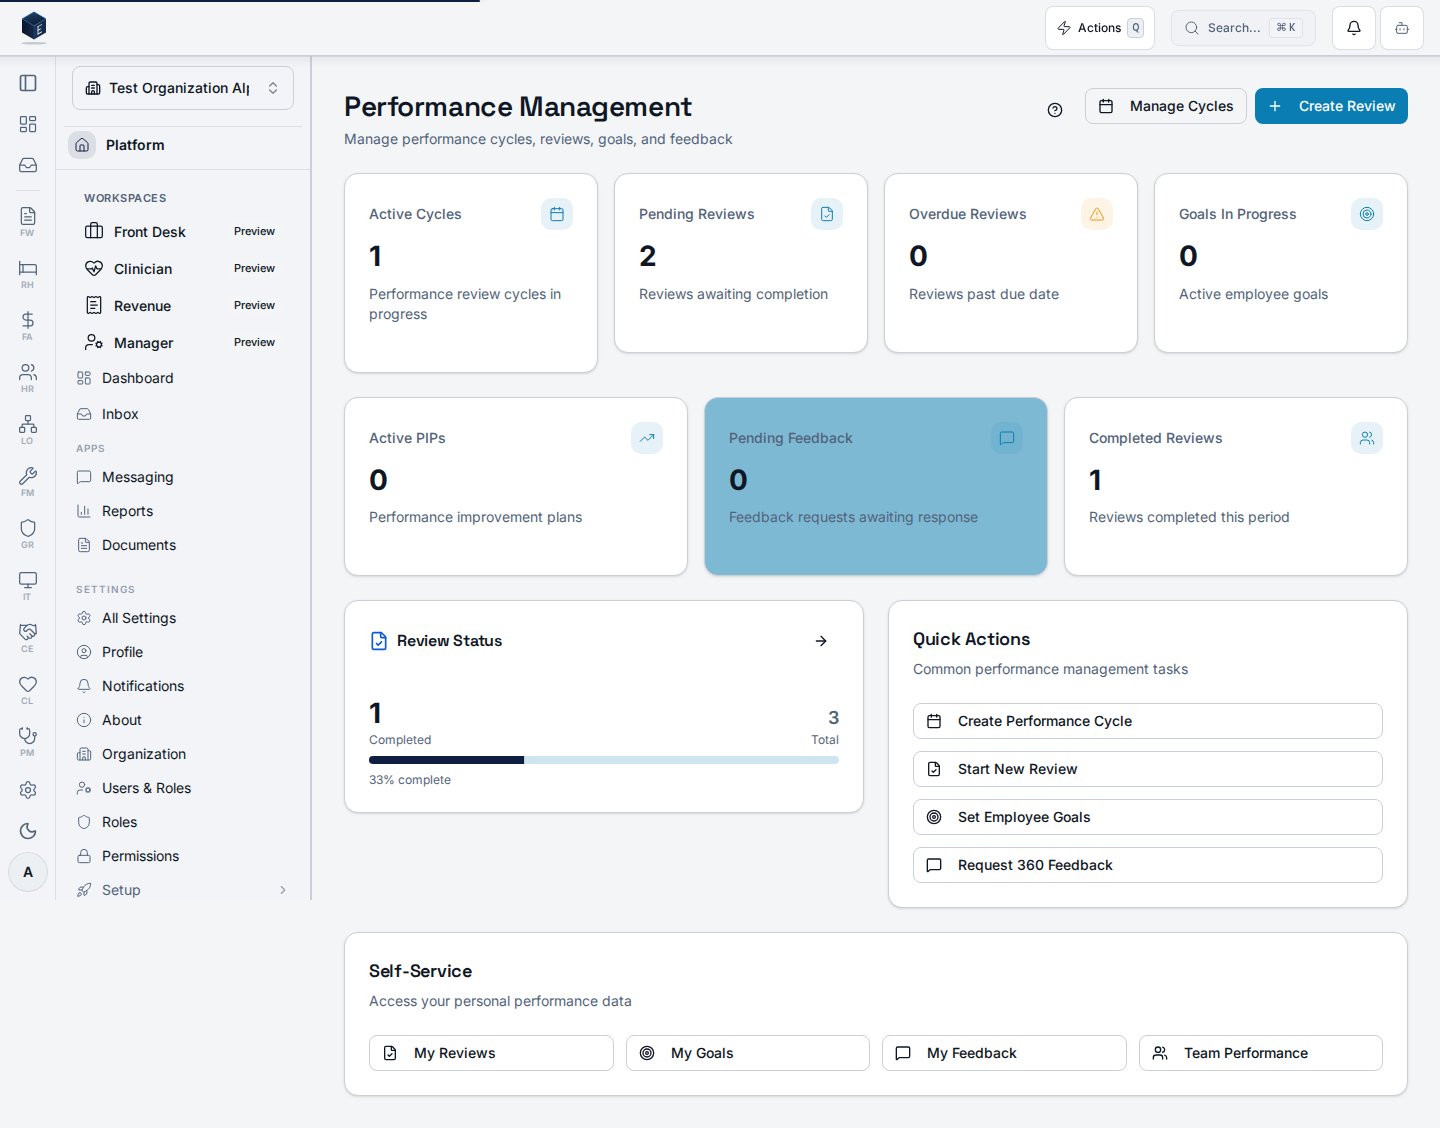
The dashboard (`/hr/performance`) opens with KPI cards — **Active Cycles**,
**Pending Reviews**, **Overdue Reviews**, and **Goals In Progress** — followed by
secondary stats (active PIPs, pending feedback, completed reviews) and a **Review
Status** completion widget.
 ## Tracking cycle completion
The **Review Status** widget is the at-a-glance health check for the active cycle.
It shows the number of completed reviews against the total, a completion-rate
progress bar, and a breakdown of pending reviews and active cycles — so an HR admin
can see how far along the cycle is without opening each review.
| Metric | What it tells you |
| ----------------- | ------------------------------------------------- |
| Completed / Total | How many reviews are finished out of all assigned |
| % complete | The cycle's overall completion rate |
| Pending | Reviews awaiting completion or acknowledgment |
| Active Cycles | How many review cycles are currently in progress |
## Review lifecycle
Each review moves through a clear set of statuses, and the dashboard counts reflect
where reviews sit:
| Status | Meaning |
| ---------------------- | ----------------------------------------------- |
| Draft | Started but not yet worked |
| In Progress | Manager is completing the review |
| Pending Acknowledgment | Submitted; awaiting the employee's sign-off |
| Completed | Acknowledged and closed, with an overall rating |
| Archived | Retained for history |
Overall ratings (exceeds / meets / needs improvement) feed the rating distribution,
and overdue reviews — in progress past the cycle deadline — surface their own KPI so
managers can be nudged before the cycle closes.
## Why a single dashboard
* **Completion at a glance** — HR sees the cycle's completion rate and the
pending/completed split without tallying reviews by hand.
* **One hub for the program** — reviews, goals, feedback, and PIPs all roll up to
the same dashboard with quick actions to start each workflow.
* **Self-service alongside** — employees reach their own reviews, goals, and
feedback from the same surface.
## Permissions
| Capability | Required access |
| ------------------------------------- | -------------------------- |
| View the performance dashboard | HR administrator / manager |
| Create cycles and start reviews | HR administrator / manager |
| Track completion rates across a cycle | HR administrator |
| View own reviews, goals, and feedback | Any authenticated employee |
The screenshot above is generated automatically from the local end-to-end test
lane (`tests/e2e/hr/hr-10-performance-docs-shots.spec.ts`, run via
`npm run docs:shots`) against synthetic seed data. That spec also runs an auto-heal
gate — it fails on any console error, page error, or HTTP ≥ 400 while driving the
surface — and verifies HR-10 acceptance criterion **AC-19** (the dashboard tracks
the cycle completion rate with a completed-vs-pending breakdown), so the image
reflects a clean, real render and is checked by the screenshot drift gate.
## Tracking cycle completion
The **Review Status** widget is the at-a-glance health check for the active cycle.
It shows the number of completed reviews against the total, a completion-rate
progress bar, and a breakdown of pending reviews and active cycles — so an HR admin
can see how far along the cycle is without opening each review.
| Metric | What it tells you |
| ----------------- | ------------------------------------------------- |
| Completed / Total | How many reviews are finished out of all assigned |
| % complete | The cycle's overall completion rate |
| Pending | Reviews awaiting completion or acknowledgment |
| Active Cycles | How many review cycles are currently in progress |
## Review lifecycle
Each review moves through a clear set of statuses, and the dashboard counts reflect
where reviews sit:
| Status | Meaning |
| ---------------------- | ----------------------------------------------- |
| Draft | Started but not yet worked |
| In Progress | Manager is completing the review |
| Pending Acknowledgment | Submitted; awaiting the employee's sign-off |
| Completed | Acknowledged and closed, with an overall rating |
| Archived | Retained for history |
Overall ratings (exceeds / meets / needs improvement) feed the rating distribution,
and overdue reviews — in progress past the cycle deadline — surface their own KPI so
managers can be nudged before the cycle closes.
## Why a single dashboard
* **Completion at a glance** — HR sees the cycle's completion rate and the
pending/completed split without tallying reviews by hand.
* **One hub for the program** — reviews, goals, feedback, and PIPs all roll up to
the same dashboard with quick actions to start each workflow.
* **Self-service alongside** — employees reach their own reviews, goals, and
feedback from the same surface.
## Permissions
| Capability | Required access |
| ------------------------------------- | -------------------------- |
| View the performance dashboard | HR administrator / manager |
| Create cycles and start reviews | HR administrator / manager |
| Track completion rates across a cycle | HR administrator |
| View own reviews, goals, and feedback | Any authenticated employee |
The screenshot above is generated automatically from the local end-to-end test
lane (`tests/e2e/hr/hr-10-performance-docs-shots.spec.ts`, run via
`npm run docs:shots`) against synthetic seed data. That spec also runs an auto-heal
gate — it fails on any console error, page error, or HTTP ≥ 400 while driving the
surface — and verifies HR-10 acceptance criterion **AC-19** (the dashboard tracks
the cycle completion rate with a completed-vs-pending breakdown), so the image
reflects a clean, real render and is checked by the screenshot drift gate.